What is Microsoft Clarity and is it a viable alternative to Google Analytics?
Microsoft Clarity is an open source website traffic analyzer touted as a promising alternative to Google Analytics. Using Clarity, web masters can easily make decisions about what changes they could, and should, make to their web pages to increase customer engagement, based on Clarity’s analysis of real-time user behavior. And, it is all completely automated.
Clarity does not have as many features, but its core functionality equals, and in some ways surpasses that of Google Analytics.
Clarity is easy to use
Clarity is easy to implement and completely intuitive to use. There are no limits on the number of sites per account, no complex settings to configure, and there are no traffic caps. It is ideal for small businesses and bloggers. For bigger companies, it can be integrated with Google Analytics. Its analytics processes are designed using AI- and machine learning-based algorithms, and it is GDPR compliant
But, what makes Clarity special?
Top 3 Clarity features that challenge Google Analytics
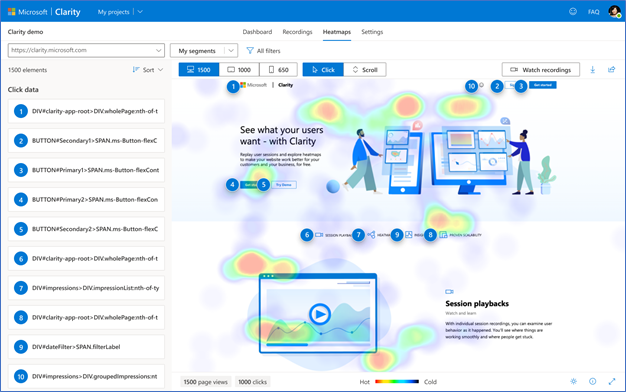
Heatmaps
Built-in clickmaps show web masters what users are viewing the most, pinpointing prime web estate areas for advertisements and focal points. Google Analytics requires a Chrome extension for heatmaps.
Session playbacks
Session playback videos are a kind of virtual user-stalking mechanism, recording a user’s entire visit to a website. Videos can be replayed to see how visitors behaved in different scenarios, for instance where they were when they decided to make a purchase, exited the site, or “rage clicked”.
Clarity talks about “rage clicks”, “quick backs”, and “dead clicks”, which help to define and analyze click behavior anomalies. For instance, repeated clicks on a field or page where is no link, and the user thinks there should be, is considered a “rage click” which can prompt the web master to address click-thru omissions.
Google Analytics does not use video, only visualizations and graphs.
Insights dashboard
The Clarity dashboard is a view of traffic usage metrics with several drill down and filtering features, for example country, device type, and duration. The main purpose of the dashboard is to identify negative and positive behaviors that may suggest webpage tweaks to improve the UX.
The dashboard also tracks JavaScript errors, popular pages, and referrers. While not as feature-rich as Google Analytics, the simplicity of the Clarity dashboard makes it more user friendly.
Clarity downsides
Clarity does not respond to browser Do Not Track settings and visitors to a website using Clarity cannot choose not to be recorded.
Microsoft does not recommend the use of Clarity on government, financial, and medical websites;.
Unlike Google Analytics, Clarity cannot itself perform sales tracking or monitor the success of an advertising campaign.
Clarity shows how website design impacts user behavior
In summary, Clarity answers the questions:
- What content is accessed the most and appears useful?
- What content should be included in focal points?
- Are users scrolling down to view content at the bottom of a page?
- In what areas are users expressing navigation frustration or confusion?
- What content is being ignored (and therefore can be removed or modified)?
- Is our new product idea feasible?
- What JavaScript errors are being thrown on the webpage?
Clartity is being compared to Google Analytics and products like HotJar, but it is the “Lite” version of these services, which for many organizations may be quite enough. Clarity reduces marketing jargon bloat and focuses on proactive solutions for website modifications.
To sign up for the service, go to the Clarity website and watch the demo or start adding your websites.